-
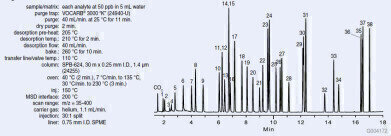 Figure 1. Conventional GC Analysis, 30:1 Split.
 -
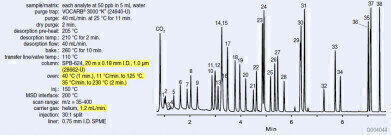 Figure 2. Fast GC Analysis, 30:1 Split.
 -
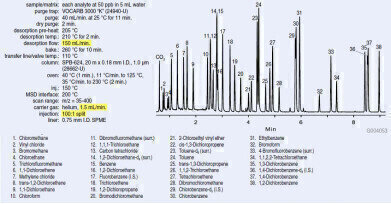 Figure 3. Fast GC Analysis, 100:1 Split.
Water/wastewater
Avoid the Sample Capacity Pitfall when Converting Volatile Methods to Fast GC
May 13 2015
Fast GC is the manipulation of several parameters to provide faster analyses while maintaining resolution. It is accomplished using a short column (reduces analysis time) with a narrow I.D. (offsets the loss of efficiency of the short column) while adjusting specific operating parameters, such as linear velocity and oven temperature ramp rates. This short eBulletin is based on a longer Reporter article that includes several more examples and chromotograms.
Converting a conventional GC method to a Fast GC method is not as simple as just changing to a smaller I.D. column. Column dimensions, linear velocity, and oven temperature ramp rates must be optimised together. Changing only one parameter may decrease analysis time (desirable), but will likely cause a loss of resolution (undesirable). It is also critical to account for the reduced sample capacity of the smaller I.D. column.
A method for the analysis of volatiles from waste water samples on a SPB-624 column was selected to illustrate the change from conventional GC to Fast GC. The optimised chromatogram obtained using conventional GC is shown in Figure 1. The analysis time is <18 minutes, peak shapes are good, and the mass spectrometer (MS) is able to mass resolve all analytes.
The column dimensions were changed to Fast GC dimensions, and then linear velocity and oven temperature ramp rates were optimised. The resulting chromatogram is shown in Figure 2 (parameters which were changed are highlighted). While analysis time is reduced to <10 minutes and the MS is still able to mass resolve all analytes, peak shape overall is not good. Why the poor chromatography? The reduced sample capacity of the smaller I.D. column was not accounted for. The capacity of the 0.18 mm I.D. column is less than the 0.25 mm I.D. column, leading to sample overload.
To alleviate this problem, the mass of sample reaching the column must be reduced. Diluting the sample, decreasing the injection volume, or increasing the split ratio are options to achieve this. The first two options are not as compatible with P&T methods as the third. Therefore, the split ratio was increased from 30:1 to 100:1, and then the linear velocity was again optimised. The resulting chromatogram is shown in Figure 3 (parameters which were changed are highlighted). Now, the short analysis time (<10 minutes) and mass resolution of all analytes is accompanied with improved peak shape of all analytes. This represents a vast improvement in analysis time (from over 17 minutes to under 10 minutes) compared to the conventional GC run, with no decrease in quality (resolution and/or peak shape).
For additional information on this or other aspects of GC, visit the GC Learning Centre, a technical repository of column selection criteria, chromatogram search tools, presentations, on-demand webcasts, and brochures/bulletins.


.jpg)

Digital Edition
IET 35.2 March
April 2025
Air Monitoring - Probe Sampling in Hazardous Areas Under Extreme Conditions - New, Game-Changing Sensor for Methane Emissions - Blue Sky Thinking: a 50-year Retrospective on Technological Prog...
View all digital editions
.jpg)


Events
EAGE Conference & Exhibition 2025
Jun 02 2025 Toulouse, France
Caspian International Power and Green Energy Exhibition
Jun 03 2025 Baku, Azerbaijan
Jun 04 2025 Koeln, Germany
Jun 04 2025 Shanghai, China
Jun 08 2025 Denver, CO, USA